
Is it time we move beyond the NPS to measure user experience?
Why the NPS sucks and what to use instead.
I get an overwhelming sense of grief and anger when I see the Net Promoter Score (NPS) being used as a beacon of light for companies. I have heard so many people praising the NPS, and using it as a legitimate way to measure customer satisfaction and success of a company. In fact, sometimes, it is used as the only way to measure these metrics. But, I really believe, the NPS should not be the basis of making critical decisions.
As user experience and user research gain traction in the tech/product field, there are so many additional ways to gather feedback, measure satisfaction, and pinpoint where you are disappointing your users. The NPS feels like a very archaic metric that stuck around simply because it is easy. And, to be honest, the other suggested metrics in this article are more difficult than the NPS, but there is a reason behind that.
What exactly is the NPS?
If you have ever tried out a product or service, you have probably seen this question before:
On a scale of 0–10 how likely are you to recommend <product or service> to a friend or colleague?
Your NPS is the accumulation of people who use your product or service taking the time to rate whether or not they would recommend your product or service to others. Based on the score they give your product or service, they fall into one of three buckets:
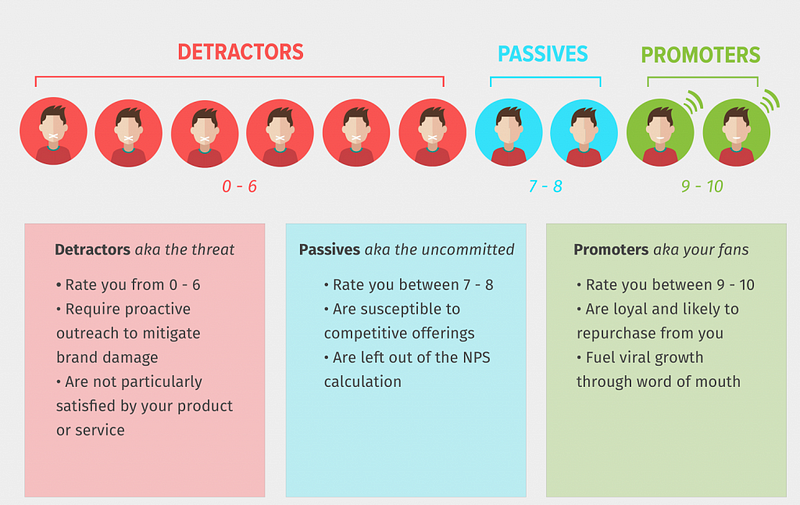
With this information, you are able to calculate a score that you can measure across time. The formula to calculate the score is:
Net Promoter Score = % of Promoter respondents minus % of Detractor respondents
Remember, passives are kept out of calculations, so any scores of 7–8 essentially do not exist in terms of scoring.
As an example, let's say you received 100 responses to your survey:
- 40 responses were in the 0–6 range (Detractors)
- 30 responses were in the 7–8 range (Passives)
- 30 responses were in the 9–10 range (Promoters)
When you calculate the percentages for each group, you get 40%, 30%, and 30%.
To finish up, subtract 40% (Detractors) from 30% (Promoters), which equals -10%. Since the Net Promoter Score is always shown as a number (not percentage), your NPS is -10. NPS scores can range from -100 to +100.
In addition, the NPS appears to do things that other business metrics don’t or can’t. It is:
- A single question that is easy to understand
- Easy to calculate and measure
- Easy to track any changes over time
- Widely accepted in business
Why the NPS is a suboptimal metric
There are a few reasons why I think NPS is not the most ideal metric to use as a single metric. I am in no way saying, “never use the NPS again!” If you want to continue measuring NPS, just understand what you are really measuring and consider additional metrics to track alongside the NPS.
- Why is recommendation a sign of satisfaction? There are so many different reasons why one might or might not recommend a product/service to a family member, friend, or colleague. Sure, we could assume the mental model of “I am satisfied with this product/service, therefore I would recommend it,” but this still leaves many situations unanswered. What if it simply doesn’t make sense to recommend the product/service to these people because they never use anything like this? Or maybe you are unsure about the value since you haven’t used it a lot. Maybe you hate it, but someone else in your life would benefit from the product/service. There are many different contributing factors to recommendations, and they don’t always lead to product success and customer satisfaction
- Recommendations are contextual and subjective. Similar to the above statement, whether or not someone gives a recommendation can be completely subjective and based on context. Would I recommend a movie I just saw to others? Maybe. It depends on the person. If it was a comedy, I would potentially recommend it to my friends who like comedy, but not my friends who like action or thrillers. I could have also had a terrible night with bad popcorn, and lumpy theater seats, causing me to dislike the movie because of circumstance, rather than quality. Or I could have simply been having a bad day, and that impacted the experience I had with a product/service, causing me to give a bad score. There is a multitude of reasons why recommendations are extremely contextual and subjective
- NPS calculation overshadows success. The weird calculation of the NPS score does a great job of hiding improvement and success. The above example gave us an NPS of -10. Now, let’s say we work super hard to make some great changes to the product/service. We know we are on the right track because we are using user research insights to help give direction to these changes (biased, I know). So, it turns out we have increased those scores, and we receive many more 6’s and 7’s. For some reason, the NPS counts the 6’s as 0’s (detractors) and the 7’s don’t count (as they are passives). So, ultimately, our NPS is still -10, despite the improvements we have made. This simply does not make sense
- You do not know what type of user is responding. The NPS does not care or categorize the respondents to the survey. So, we don’t know if the people who are responding are power users, new users, or even our target personas for the product. If we have spent time building for certain types of personas but are getting scores from other people out of our scope, that can completely skew the results. It is also easy to skew the results in the other direction — you could be getting good reviews from people who you are not at all trying to target
- Cultural differences could impact your score. If you are a global company and are collecting responses from many different countries, it is extremely important to study the NPS data per country. There are vast differences in how cultures respond to these types of surveys, which can really mess up your data if you are lumping them together. It is best to keep an eye on the country or region your responses are coming from and to separate that out
- An 11-point scale is really large. The NPS gives a very large range of responses as an 11-point scale. In fact, it is one of the largest scales. The distinction between the numbers is not at all clear, and most likely does not make sense from person-to-person. You and I could have the same exact experience but I would give the product a score of a 7, and you give the score of a 6. What is the difference between 6 and 7? It is very hard for respondents to understand this difference, and to choose a meaningful response. It is almost the same as closing your eyes and picking between two numbers
- There is no data on ‘why’ someone gave a particular rating. Aside from all of these, my biggest gripe with NPS is that there is no understanding of why someone gave a particular score. Receiving a rating can be rather useless if you don’t understand the motivation behind the score. Without the ‘why,’ there is no way for a company to determine how to improve a product or what direction to move in. Perhaps it was an error beyond your control that led to a lower score. Without understanding the ‘why,’ you can spend much time and energy trying to guess what went wrong and how to fix it
- It is completely future-based. I do my best to avoid asking future-based questions. We want to focus on what people have done in the past, as most of us cannot predict our future behavior (think of all the gym memberships that go unused).
What to do instead (or in addition to)
Now that I have bashed the NPS as a single-source metric, I would love to give some alternatives to the NPS or to measure alongside the NPS. We all know people love numbers and measurements and there are some other questions we could be asking (hint: they might not be as easy, but could be more effective). You can even continue to include the positive/negative aspect of the NPS.
Frustration:
- How delighted or frustrated were you today? — Extremely delighted (+2), delighted (+1), meh (0), frustrated (-1), extremely frustrated (-2)
- In the past X weeks, have you felt frustrated with our product/service? — Yes (-1), Unsure (0), No (+1)
Helpfulness/happiness:
- Have we been helpful today? — Yes (+1), Unsure (0), No (-1)
- Have we made you happy today? — Yes(+1), Unsure (0), No (-1)
Loyalty:
- In the last X weeks, did you recommend us to a friend or family member? — Yes(+1), No(-1)
- Have you ever recommended us to a friend or family member? — Yes(+1), No(-1)
- Were you recommended to us by a friend or family member? — Yes (+1), No (-1)
- In the last X weeks, have you considered [canceling your subscription, switching to another provider, etc.]? — Yes (-1), No (+1)
Satisfaction:
- How satisfied are you with [company X]? — Very dissatisfied (-2), Dissatisfied (-1), Neither (0), Satisfied (+1), Very satisfied (+2)
- How easy was it to complete your order online? — Very easy (+2), Easy, (+1), Neither (0), Difficult (-1), Very difficult (-2)
Finally, always leave an open-ended text field asking something along the lines of “how could we improve?” This adds to the qualitative input you can receive to give you a better indication of what went wrong and the context of the situation. This will help in providing more clear direction towards product/service improvements.
Ultimately, user experience and satisfaction cannot be boiled down to one singular number. Let’s keep an open mind about what we measure, how we measure, and why we are using specific metrics, so we are best able to make better, well-rounded data-driven decisions. And, don’t forget to add in some qualitative research as well!
If you liked this article, you may also find these interesting:
- Asking about the future in user research
- A case for beta testing
- First-person surveys in user research
- Benchmarking in user research
Interested in more user research? I teach an Introduction to User Research Course and am available for one-on-one mentoring. Check out the User Research Academy.
Please join the User Research Academy Slack Community for more updates, postings, and Q&A sessions